
Bitcoin
Supply Reaches All-Time High HODLing Levels

Data shows the Bitcoin supply has now reached all-time high HODLing levels, a sign that could be bullish for the price of the crypto.
Bitcoin HODLed Or Lost Coins Metric Has Hit A New ATH
As per the latest weekly report from Glassnode, investors have been showing some aggressive accumulation behavior recently.
There are a couple of relevant indicators here. The first is the “HODLed or Lost Coins,” which measures the total number of coins that have been sitting dormant on the blockchain. Such coins either belong to the HODLers, or are simply inside wallets that have been lost (hence the name of the metric).
The other indicator is the “HODLer Net Position Change,” which tells us the amount of Bitcoin that is entering or exiting this dormant supply right now.
When the HODLer supply goes up, it means investors have been accumulating more and holding strong onto their coins recently.
Now, here is a chart that shows the trend in both these Bitcoin indicators over the last couple of years:
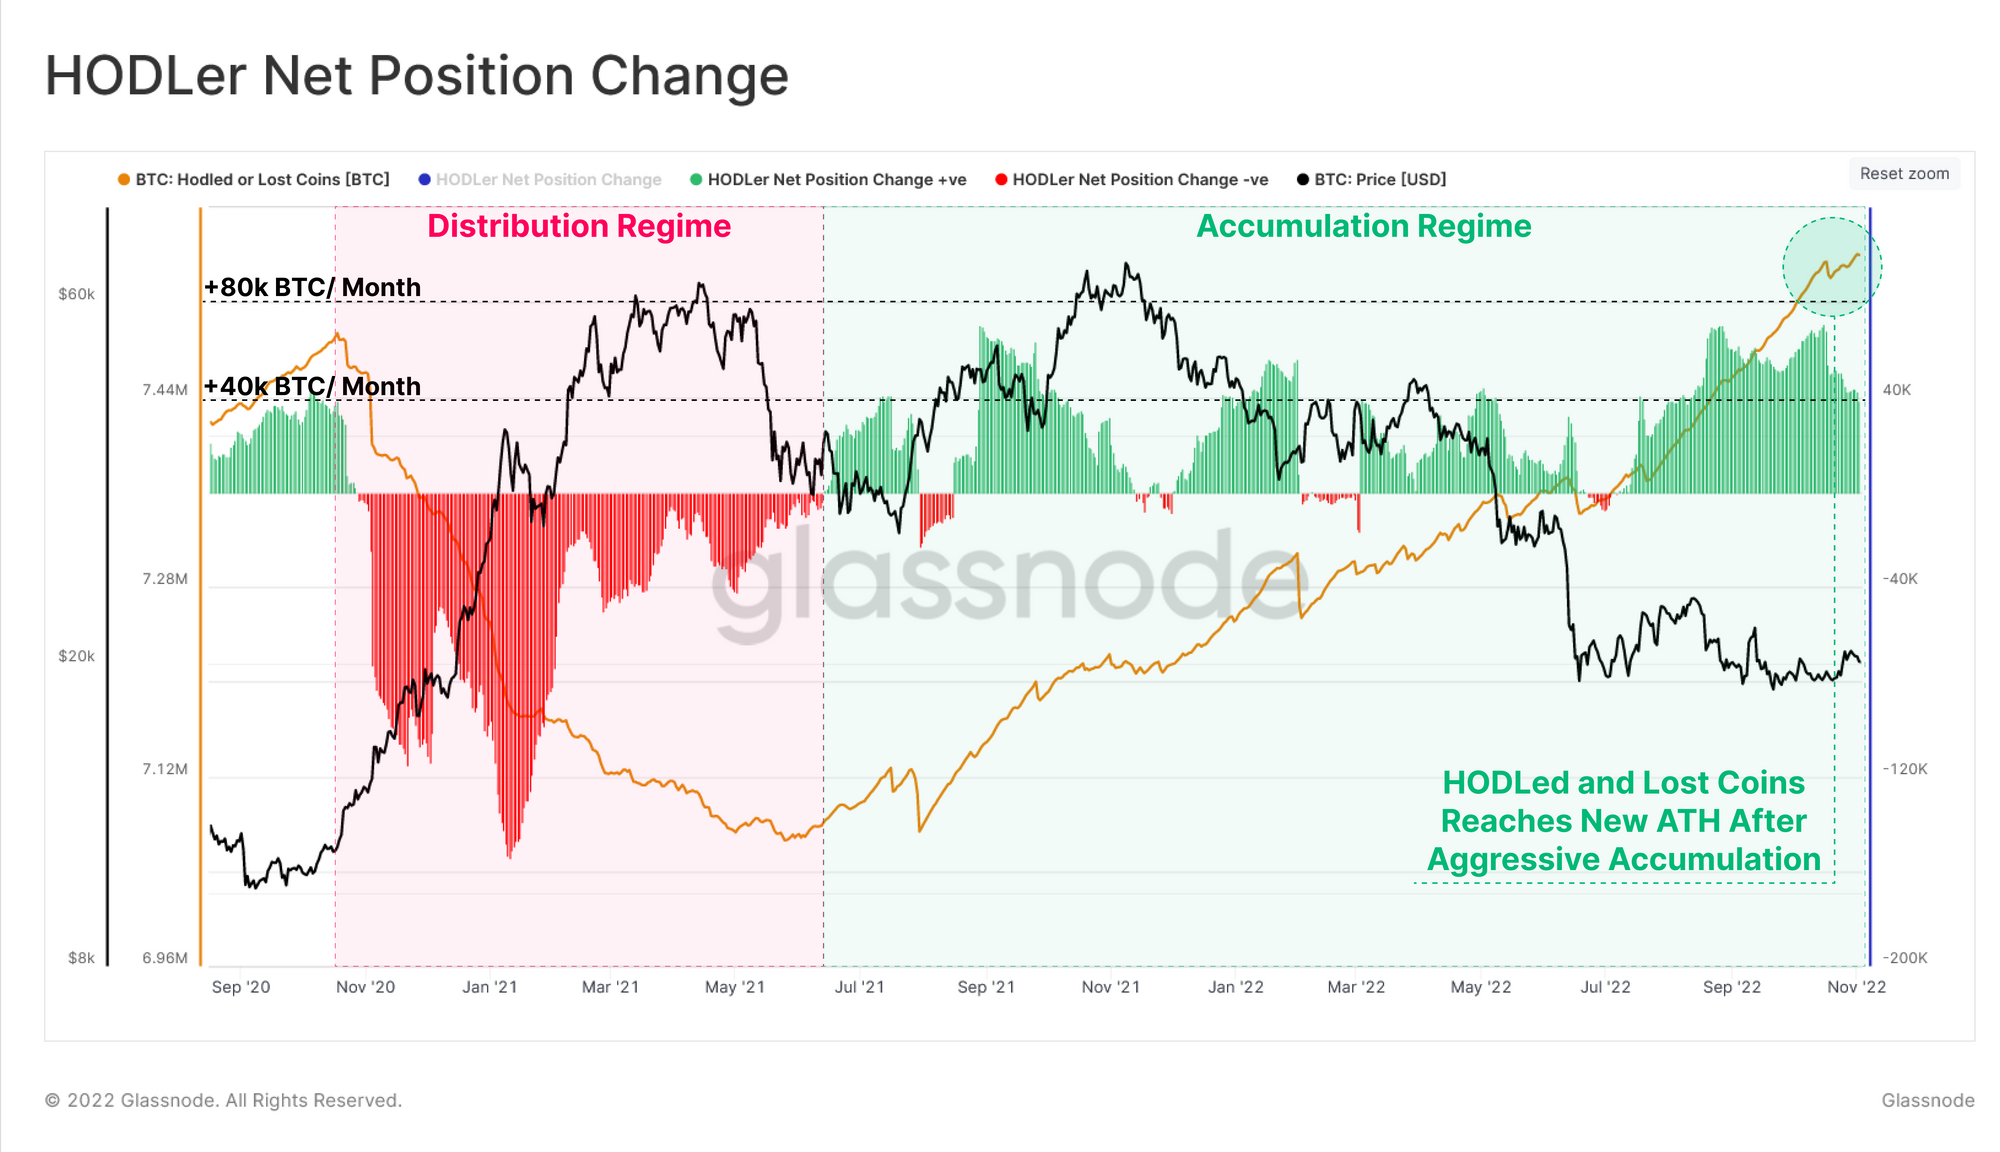
The value of the two metrics seems to have been high in recent weeks | Source: Glassnode's The Week Onchain - Week 45, 2022
From the above graph, it’s apparent that the Bitcoin HODLer or Lost Coins supply had a high value just before the 2021 bull run hit in full swing.
After it started, however, the indicator declined as HODLers began to sell for profit. This trend of negative net position change in their supply ran until May 2021, when a reversal occurred.
The investors have been generally holding strong and accumulating more coins since then, as the green net position change shows.
As a result of this accumulation, the Bitcoin HODLer or Lost Coins metric has now reached a new all-time high.
Another way to see this aggressive HODLing behavior is through the “Supply Last Active < 6 Months” indicator, which measures the amount of BTC that has seen some movement within the last six months.
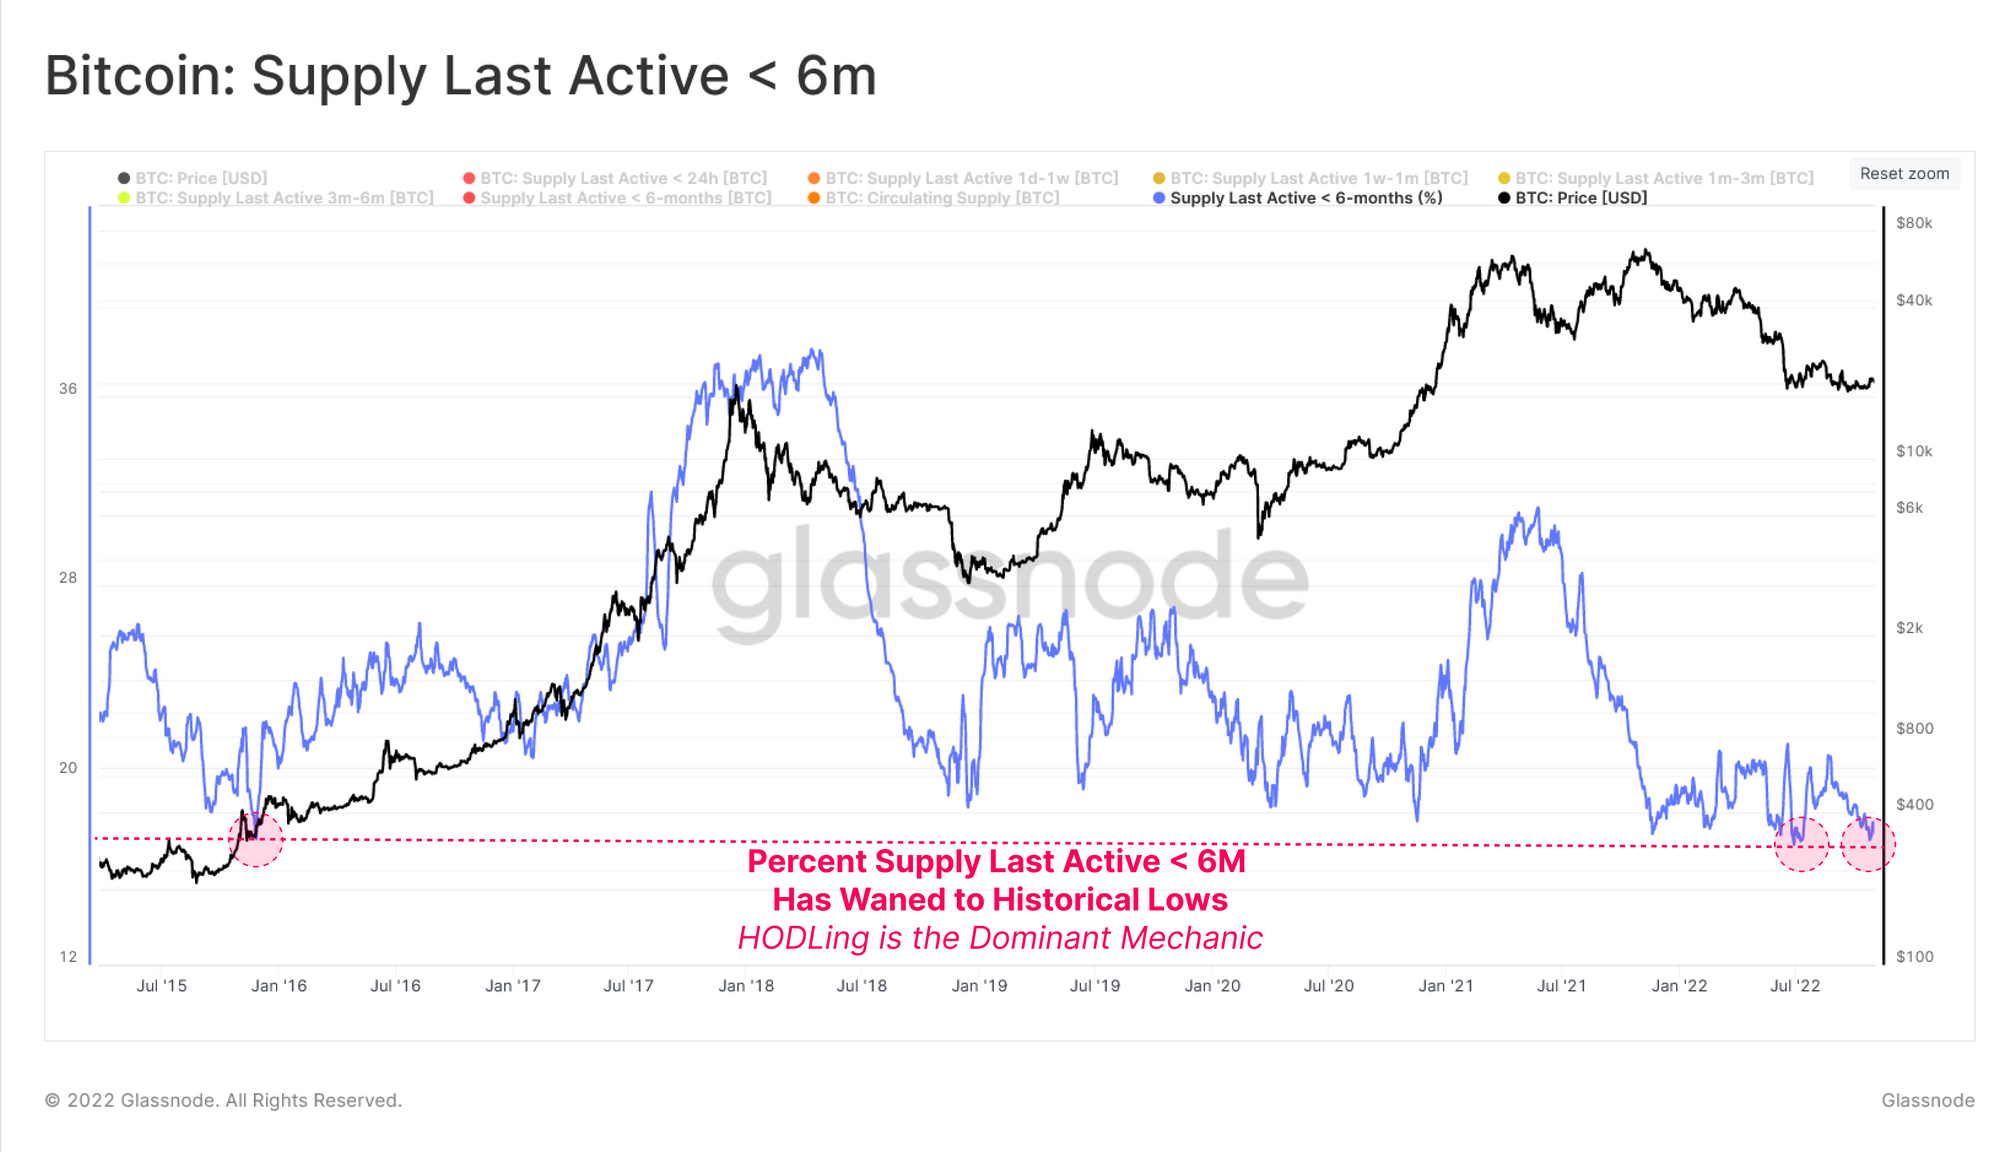
Looks like this metric has declined recently | Source: Glassnode's The Week Onchain - Week 45, 2022
As you can see in the chart, the percentage of the Bitcoin supply last active within the past six months is currently at historical lows.
This means that a huge chunk of the supply has been dormant in recent times, further proving the extreme HODLing that is taking place right now.
Naturally, this kind of investor mentality can be bullish for the price of the crypto in the long term.
BTC Price
At the time of writing, Bitcoin’s price floats around $19.6k, down 4% in the last week.

The value of the crypto plummets down | Source: BTCUSD on TradingView
Featured image from Quaritsch Photography on Unsplash.com, charts from TradingView.com, Glassnode.com


