
Market
Bitcoin Price Recovery Faces Hurdle, Why 100 SMA Presents Resistance

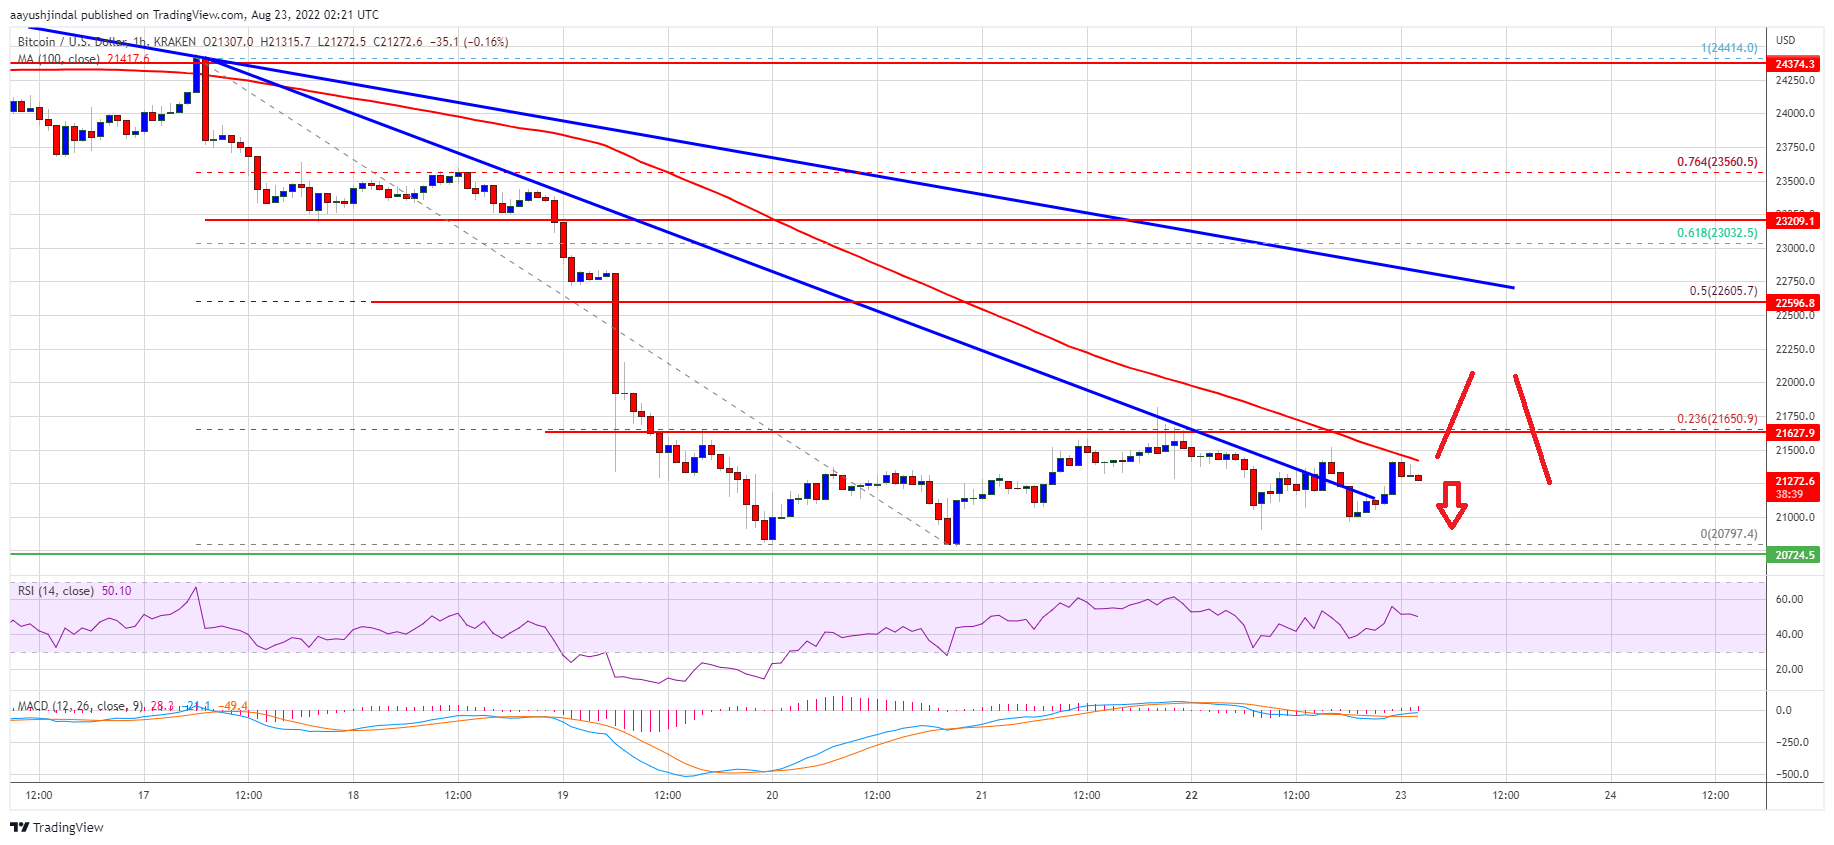
Bitcoin found support near $20,750 against the US Dollar. BTC is correcting gains, but it is facing resistance near $21,500 and the 100 hourly SMA.
- Bitcoin found support near the $20,750 after a strong decline.
- The price is now trading below the $21,500 level and the 100 hourly simple moving average.
- There was a break above a major bearish trend line with resistance near $21,270 on the hourly chart of the BTC/USD pair (data feed from Kraken).
- The pair could recover higher if there is a clear move above the $22,000 resistance.
Bitcoin Price Struggles
Bitcoin price gained bearish momentum below the $22,000 support zone. BTC declined below the $21,200 and $21,000 support levels before the bulls appeared.
A low was formed near $20,797 and the price started a short-term upside correction. There was a minor upward move above the $21,000 level. Besides, there was a break above a major bearish trend line with resistance near $21,270 on the hourly chart of the BTC/USD pair.
However, bitcoin price faced a strong resistance near the $21,500 level and the 100 hourly simple moving average. It is now struggling to clear the $21,500 resistance zone.
On the upside, an immediate resistance is near the 100 SMA at $21,450. The first major resistance on the upside sits near the $21,650 level. It is near the 23.6% Fib retracement level of the key decline from the $24,415 swing high to $20,797 low.
Source: BTCUSD on TradingView.com
The main resistance is forming near the $22,000 zone. Any more gains might send the price towards the 50% Fib retracement level of the key decline from the $24,415 swing high to $20,797 low. A close above the $22,500 and $22,650 resistance levels might push the price into a positive zone.
More Losses in BTC?
If bitcoin fails to clear the $21,500 resistance zone and the 100 hourly SMA, it could continue to move down. An immediate support on the downside is near the $21,000 level.
The next major support now sits near the $20,800 level. A downside break and close below the $20,800 level might start another major drop. In the stated case, the price might decline towards the $20,000 level.
Technical indicators:
Hourly MACD – The MACD is now losing pace in the bearish zone.
Hourly RSI (Relative Strength Index) – The RSI for BTC/USD is now above the 50 level.
Major Support Levels – $21,000, followed by $20,800.
Major Resistance Levels – $21,500, $22,000 and $22,650.


